Resources

Resources

Resource Center

  • Force-distance curves

    Force-distance curves

    Force is measured in an SFM by collecting a force curve, which is a plot of cantilever deflection, dc, as a function of sample position along the z-axis (i.e. towards or away from the probe tip; the z-piezo position). It assumes a simple relationship (i.e. Hooke’s F = - k dc

    where k is the spring constant of the cantilever. Some other forces included in tip-sample interaction under dc approach or retracting motion are presented on the figure left [1]. Used definitions see below. The interpretation of AFM force curves relies almost entirely on established force laws, particularly those determined using the SFA [2]. These force laws describe force as a function of the probe–sample separation distance (D) rather than as a function of the z-piezo position. Thus, to be useful, the force curves must be transformed into descriptions of force as a function of distance, F(D). However, current SFMs do not have an independent measure of D. Instead, the transformation to D is achieved by subtracting the cantilever deflection from the z-piezo movement.

    For a very hard surface, zero separation is defined as the region in the force curve in which the cantilever deflection is coupled 1:1 with the sample movement; this appears in the force curve as a straight line of unit slope. A corrected curve is called a force–distance curve. Notice that determining D by this approach requires that the tip make contact with the sample. In practice, there are two factors (long-range forces and sample elasticity) that can make determining the point of contact very difficult. A complete force curve includes the forces measured as the probe approaches the sample and is retracted to its starting position. Because the forces on the tip can vary as it is moved toward or away from the sample, for the purposes of presentation, we will divide the force curve into approach and retraction portions and consider them separately.

    References

    1. TIBTECH 17, 143 (1999).

    2. Israelashvili, J.N. (1992) Intermolecular and Surface Forces, Academic Press.


  • Adhesion Force Microscopy

    Adhesion Force Microscopy

    The retracting portion of the force curve sometimes follows the approach curve; however, there is often hysteresis. The most common type of hysteresis is due to some sort of adhesion, which appears in the force curve as a deflection below the zero-deflection line. The source of the adhesion can vary depending on the sample. In the ideal case of a sphere interacting with a flat surface, the adhesion force can be related to the radius of the sphere and the surface energies of the two surfaces.

    Under ambient conditions, the main source of adhesion is the formation of a capillary bridge between the tip and the sample. In air, most samples have several nanometers of water adsorbed to the surface; this water layer wicks up the tip and forms a ‘bridge’ between the tip and the sample. Pulling the tip out of that bridge requires a large force to overcome the surface tension. In fluid, the adhesive force depends on the interfacial energies between the tip and sample surfaces, and the solution; varying the solution can thus change the force of adhesion.

    A different form of ‘adhesion’ occurs when a polymer is captured between the AFM tip and the substrate. In this case, there is a very distinctive ‘adhesive’ force as the tip is pulled away. Typically, these curves initially retrace the approach curve near the surface but, away from the surface, exhibit a smooth negative deflection as the polymer is stretched until it breaks or detaches from the tip or the substrate, and the cantilever returns to the zero-deflection line. If multiple polymer molecules attach to the tip and substrate, a saw-tooth pattern can be observed as individual polymers detach. For references concerning different kinds of adhesive forces see [1, 2].

    To be useful, the force curves must be transformed into descriptions of force as a function of distance, F(D). However, current SFMs do not have an independent measure of D. Instead, the transformation to D is achieved by subtracting the cantilever deflection from the z-piezo movement.

    In some cases detachment of the tip under retractive motion of scanner occurs abrupt, and suitable force (force of adhesion) can measured relatively correctly.

    Corresponding adhesion maps are typically produced by taking the most negative force detected during the retraction curve as the value for adhesion and plotting that value against the x–y position of each curve. Several types of spatially resolved adhesion map can be produced, for example, the spatial distribution of adhesion in grafted-polymer systems. Using a special AFM tips, modified by antibodies or ligands, one can map the distribution of specific proteins on the surfaces of living cells etc.

    References

    1. TIBTECH 17, 143 (1999).

    2. Israelashvili, J.N. (1992) Intermolecular and Surface Forces, Academic Press.


  • Amplitude-distance curves

    Amplitude-distance curves

    Amplitude-modulation (intermittent-contact, semicontact) mode is widely spreaded oscillating mode and generally speaking can be interpreted and described by the amplitude, phase, frequency and dissipation on one another or on the cantilever-sample distance dependences.

    The study of such dependences is necessary according to following circumstances. First of all it relates to obtaining high-grade images (without noise and with high resolution). Then the study of suitable dependences can help in determining the nature of tip-sample interaction, defining forces included in this interaction and formation SPM images. At last the study of suitable curves can help in obtaining more contrastive images and quantitative parameters of sample under investigation.

    Obtained in Amplitude-modulation mode images are determined by the row of factors related to the sample as well as to conditions of measurement and values of scanning parameters.

    For interpreting results of amplitude-modulation mode usage one can to study dependence of oscillation amplitude the tip-sample distance. Suitable amplitude-distance (a-d) curves (their typical view one can see on the animated picture) can be monotonic or can to have areas of bistability and hysteresis. The presence of the bistability (as is shown on the same picture) leads to arising of the artifacts on the images obtained in Amplitude-modulation mode.

    Origin of bistability lies in possibility of simultaneously co-existence oscillations predominantly in attractive or predominantly in repulsive potentials.
    The bistability also can arise in complicated shape of tip-sample potential when in initial area cantilever stiffness is greater than potential derivative and the potential derivative becames greater tha cantilever stiffness.

    With suitable choise of set-point amplitude of cantilever oscillation, its stiffness, sharpness of the tip one can reach conditions when over all sample surface under investigation areas with bistability are absent.

    References

    1. Phys. Rev. B 60, 4961 (1999).

    2. Surface Sciece 460, 292 (2000).

    3. Phys. Rev. B 66, 041406 (2002).


  • Phase-distance curves

    Phase-distance curves

    Amplitude-modulation (intermittent-contact, semicontact) mode is widely spreaded oscillating mode and generally speaking can be interpreted and described by the amplitude, phase, frequency and dissipation on one another or on the cantilever-sample distance dependences.

    The study of such dependences is necessary according to following circumstances. First of all it relates to obtaining high-grade images (without noise and with high resolution). Then the study of suitable dependences can help in determining the nature of tip-sample interaction, defining forces included in this interaction and formation SPM images.

    At last the study of suitable curves can help in obtaining more contrastive images and quantitative parameters of sample under investigation. Obtained in Amplitude-modulation mode images are determined by the row of factors related to the sample as well as to conditions of measurement and values of scanning parameters.

    For interpreting results of amplitude-modulation mode usage one can to study dependence on the tip-sample distance the phase lag between cantilever oscillations and driving force. Suitable phase-distance (p-d) curves (their typical view one can see on the animated picture) can be monotonic or can to have areas of bistability and hysteresis. The presence of the bistability (as is shown on the same picture) leads to arising of the artifacts on the images obtained in Amplitude-modulation mode. Origin of bistability lies in possibility of simultaneously co-existence oscillations predominantly in attractive or predominantly in repulsive potentials.

    The bistability also can arise in complicated shape of tip-sample potential when in initial area cantilever stiffness is greater than potential derivative and the potential derivative becames greater than cantilever stiffness.

    With suitable choise of set-point amplitude of cantilever oscillation, its stiffness, sharpness of the tip one can reach conditions when over all sample surface under investigation areas with bistability are absent.

    References

    1. Phys. Rev. B 60, 4961 (1999).

    2. Surface Sciece 460, 292 (2000).

    3. Phys. Rev. B 66, 041406 (2002).


  • Frequency-distance curves

    Frequency-distance curves

    Analyzing the measured frequency shift versus distance curves one can determine the distance dependence of the tip-sample force. The results of such analyzing demonstrate that not only non-contact, but also elastic contact forces can be quantitatively measured by dynamic force spectroscopy opening a new and direct way to the verification of contact mechanical models of nanoasperities [1].

    Frequency-distance (f-d) curves show a similar overall shape. As one can see on the animated picture during the approach of the cantilever to the sample surface, the frequency shift decreases and reaches a minimum. With a further reduction of the nearest tip-sample distance, the frequency shift increases again and becomes positive. For smaller resonance amplitudes, the minimum of the Df(z) curves is deeper and the slope after the minimum is steeper than for larger amplitudes. Also f-d curves became deeper in area with increased adhesion force.

    A comparative experimental and theoretical study of the frequency shift in dynamic force microscopy in dependence of the tip-sample distance and the resonance amplitude revealed that frequency shift versus distance curves obtained with different amplitudes scale with 1/A3/2 and can therefore be condensed to a single normalized frequency shift curve [2].

    This experimental force curve shows good agreement with specific force laws for long-range (van der Waals), short-range (Lennard-Jones), and contact (Hertz/DMT) forces [3].

    References

    1. Phys. Rev. B 61, 12678 (2000).

    2. Phys. Rev. B 56, 16010 (1997).

    3. Appl. Phys. Lett. 75, 433 (1999).


  • Tip Enhanced Raman Scattering

    Tip Enhanced Raman Scattering

    Tip-Enhanced Raman Spectroscopy (TERS) is an advanced technique that combines the high spatial resolution of Scanning Probe Microscopy (SPM) with the sensitivity of Raman spectroscopy. TERS provides detailed chemical information at the nanoscale, which is crucial for understanding the molecular composition, structure, and properties of materials at very fine scales.


    Principle of TERS:

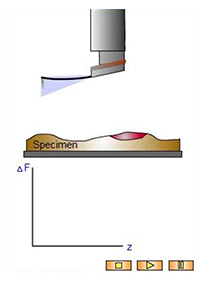
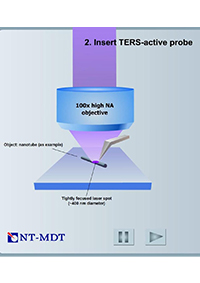
    TERS works by enhancing the Raman signal of molecules in close proximity to a sharp metallic tip, usually made of silver or gold. The sharp tip, typically part of a scanning tunneling microscope (STM) or atomic force microscope (AFM), acts as an antenna to enhance the Raman scattering, thus enabling the detection of Raman signals from a localized region as small as a few nanometers.


    Here's how TERS works step by step:


    Raman Scattering:

    Raman scattering occurs when a monochromatic light (usually from a laser) interacts with the molecules in the sample, causing the molecules to scatter the light. This scattered light is shifted in frequency by an amount that corresponds to vibrational modes of the molecules, which is the basis of Raman spectroscopy.


    Enhanced Signal:

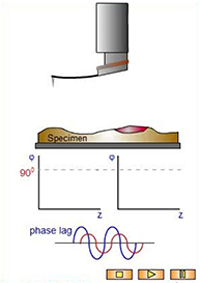
    In TERS, a sharp metallic tip (typically a nano-sized tip of a metal like gold or silver) is brought very close to the sample surface. The electric field of the incident laser light is strongly enhanced at the apex of the tip, creating a localized plasmonic field. This enhancement of the electromagnetic field leads to a much stronger Raman scattering signal from the region immediately beneath the tip.


    Tip-Substrate Interaction:

    The electromagnetic field enhancement (known as surface plasmon resonance or SPR) is localized at the very tip of the probe. This allows TERS to detect Raman signals from a very small area (as small as a few nanometers) near the tip, which is orders of magnitude smaller than the diffraction limit of conventional Raman microscopy.


    Spatial Resolution:

    Traditional Raman spectroscopy has a spatial resolution limited by the diffraction of light (typically around 1 µm). However, TERS can break this limitation, allowing for spatial resolutions down to nanometer scales (typically between 10 nm and 100 nm), depending on the tip shape, material, and experimental setup.


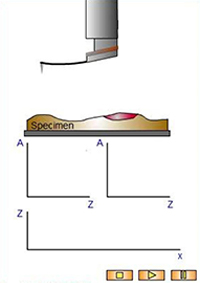
    Simultaneous Topography and Spectroscopy:

    Since TERS is typically combined with atomic force microscopy (AFM) or scanning tunneling microscopy (STM), the technique allows for simultaneous acquisition of both topographical (surface structure) and spectroscopic (chemical) information at the nanoscale. This dual capability makes it highly useful for surface characterization and molecular imaging.


    Key Components of TERS Setup:

    Laser Source: Provides the excitation light for Raman scattering.

    Metallic Tip: Usually gold or silver; it is the key to enhancing the Raman signal by creating localized plasmonic fields.

    Sample: The material or surface under investigation.

    Detector (e.g., CCD or spectrometer): Detects the scattered light and analyzes the Raman spectra.

    Scanning Probe Microscope (AFM or STM): Provides high-resolution topographic imaging and controls the position of the tip over the sample.


    Applications of TERS:

    Nanomaterials: Characterizing the molecular composition and properties of nanoparticles, nanowires, and thin films.

    Surface Chemistry: Investigating surface reactions and interactions at the atomic or molecular scale.

    Biomolecules: Studying DNA, proteins, and other bio-molecules with nanoscale precision.

    Catalysis: Observing the reaction pathways and intermediates in catalytic processes at the surface level.

    Semiconductors: Analyzing the electronic and vibrational properties of semiconductor materials.


    Advantages:

    High Spatial Resolution: TERS can provide spatial resolutions down to the nanometer scale, much beyond the diffraction limit of light.

    Molecular Sensitivity: The technique provides rich molecular information similar to Raman spectroscopy, including chemical composition, vibrational modes, and chemical bonding.

    Nanoscale Surface Characterization: TERS enables the study of surface properties at the atomic and molecular level, which is particularly valuable for advanced materials research.


    Challenges:

    Tip-Related Artifacts: The quality of the TERS signal is highly dependent on the sharpness and cleanliness of the metallic tip. Imperfections in the tip can lead to variations in the enhancement and the quality of the spectra.

    Complex Setup: The setup requires sophisticated equipment, including high-resolution AFM or STM systems, and precise alignment.

    Sample Preparation: Samples need to be prepared in a way that they are suitable for TERS measurements, as the technique often requires a conductive surface and a sharp tip.


    Summary:

    Tip-Enhanced Raman Spectroscopy (TERS) is a powerful tool that allows for high-resolution molecular imaging and spectroscopy at the nanoscale by leveraging the electromagnetic field enhancement created by a sharp metallic tip. It combines the strengths of Raman spectroscopy and scanning probe microscopy to provide detailed chemical and structural information with spatial resolution much beyond traditional optical techniques.


  • ×

    13817907735